logo
logo

Get in touch

Awesome Image Awesome Image

Data Visualization, Reporting & Dashboarding

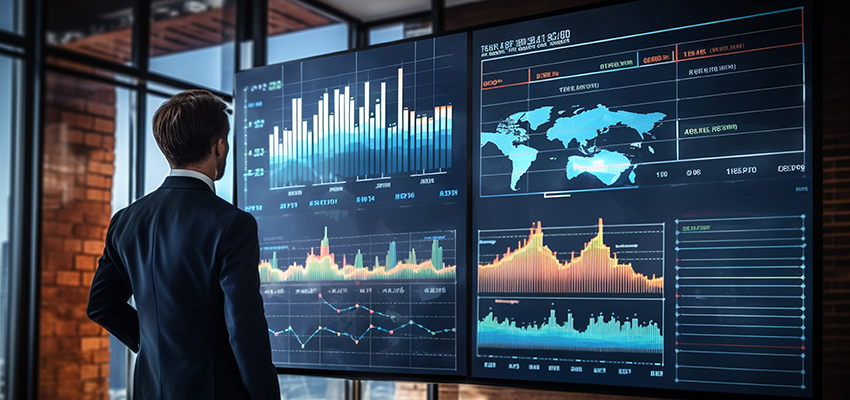
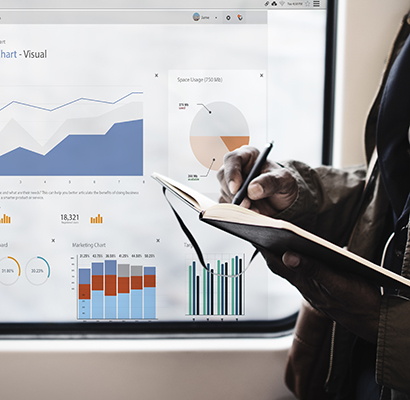
Bring your raw data to life for your company through Thistle Media's Dashboard & Data Visualization Services in Bangalore. We can take complex data sets and allow that to turn into intuitive dashboards and reports, so your business knows exactly where it stands, on the fly. Our data visualization solutions help teams with their analytical tools and identification of trends, as well as the tracking and forecasting of performance—results in better strategies for decision-making.

With our knowledge, you can translate static data into dynamic, interactive dashboards that give you an in-real-time read-out of your KPIs, metrics, and analytics. As Bangalore's leading Dashboard & Data Visualization Company in Bangalore, Thistle Media has learned one customized reporting solution that balances the many specific needs of the business so that decision-makers see clarity in actions.
  • + Custom Dashboard Design
  • + Real-Time Data Visualization
  • + Automated Reporting Solutions
  • + KPI & Metric Tracking Dashboards
  • + Interactive Data Storytelling
  • + Data Integration & API Connectivity
Awesome Image
Awesome Image
Tailored Solutions for Every Business

No two businesses are alike, and neither are their data needs. At Thistle Media, we create fully customized dashboards and reporting solutions based on your unique objectives and challenges.

Industry Expertise

Our team has extensive experience across industries—whether it’s retail, finance, healthcare, or technology. We know how to extract valuable insights from data and translate them into visually appealing, easy-to-understand formats.

Real-Time Insights

Our dashboards provide you with real-time updates, giving you instant access to critical business data. This means you can react quickly to market changes, improving efficiency and decision-making across the board.

End-to-End Service

As a full-service Dashboard & Data Visualization Agency in Bangalore, we handle everything from data collection and integration to visualization and reporting. We ensure your dashboarding and reporting process is seamless, allowing you to focus on what matters most—growing your business.

Benefits of Data Visualization & Reporting

Improve Decision-Making

Well-visualized data allows decision-makers to comprehend complex information faster, leading to more accurate and timely decisions.

Enhance Efficiency

By visualizing real-time data, businesses can spot bottlenecks, areas for improvement, and high-performing areas more effectively.

Strengthen Strategy Development

Data visualization helps you monitor progress towards business goals, allowing for more data-driven, strategic planning.

Increase ROI

By making data more accessible and understandable, businesses can harness data’s full potential, leading to smarter investments and higher ROI.

Unlock the power of your data with our advanced Digital Analytics solutions and drive informed decision-making for exponential growth


Ready to unlock the power of your data? Contact Thistle Media, the leading provider of Digital Analytics solutions in Bangalore, and discover how our expert data visualization, reporting, and dashboarding services can transform your insights into actionable strategies. Let us bring clarity to your data!

By harnessing advanced analytics techniques and tailored reporting solutions, Thistle Media will empower your business to make informed decisions, drive performance, and achieve remarkable growth in today’s data-driven landscape. Trust the best Digital Analytics partner in Bangalore to elevate your business intelligence.

FAQs

Data visualization is basically the graphical representation of data and information. It helps people see trends, outliers, and patterns in data using visual elements such as charts, graphs, and dashboards.

Being one of the top Dashboard & Data Visualization Firm in Bangalore, we create custom dashboards and reports that help businesses understand their data and discover actionable insights.

We work with various platforms: Tableau, Power BI, Google Data Studio, and all the others depending on the needs of your business.

Yes, we can merge data coming from multiple sources; for example, databases, spreadsheets, and cloud-based systems to create a unified dashboard that gives you an all-around view.

We maintain strict security measures where data exchange and storage remain encrypted. We keep sensitive business information under close wraps.

Any form of business that has data collection and processing can benefit from our Dashboard & Data Visualization Services in Bangalore. We work with firms of any size and any industry.

The value depends upon the complexity of your data, but most businesses begin to realize value from using these types of visualizations within the first few weeks of implementation.

We offer comprehensive training sessions on how to fully use the dashboards and reports that we develop for your use.

A report typically shows static information for a particular period of time, whereas a dashboard is an interactive representation that makes real-time, dynamic information visually presentable.

Costs of services would depend on scope and specifics of the project as well as the complexity of data and specific business needs. We offer custom packages for any requirement and budget.

Work with us

We would love to hear more about your project